Nutritional advice

Overweight

Scientific studies (review articles) on the relationship between diet/nutrients and overweight prevention:
One swallow does not make a summer. A famous Dutch saying that could not be any more obvious. Just because one single scientific study about a certain topic makes certain claims, it does not necessarily mean it is true. On the other hand, a review article (a collection of scientific studies on a certain topic) of randomized, placebo-controlled double blind clinical trials (RCTs) will answer the following question:
"Do taking dietary supplements make sense?" Yes for a positive conclusion and no for a negative conclusion.

One swallow does not make a summer. A famous Dutch saying that could not be any more obvious. Just because one single scientific study about a certain topic makes certain claims, it does not necessarily mean it is true. On the other hand, a review article (a collection of scientific studies on a certain topic) of cohort studies or case-control studies will answer the following question:
"Should I change my diet?".

2023:

  1. Causal relationship between sugar-sweetened beverages consumption and higher BMI and body weight

2021:

  1. High protein diets causally have beneficial effect on body weight management
  2. High circulating vitamin C level reduces metabolic syndrome
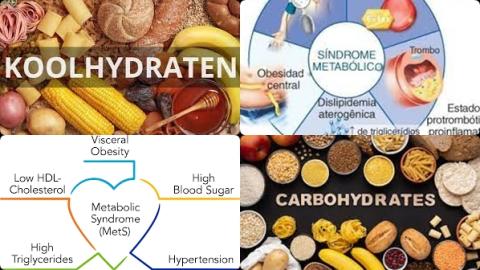
  3. Carbohydrate intake increases metabolic syndrome
  4. Poultry consumption decreases metabolic syndrome
  5. Nut consumption does not increase adiposity
  6. Obesity increases colorectal cancer in men with Lynch Syndrome
  7. A diet with low GI increases metabolic syndrome
  8. Hyperlipidemia, obesity and high alcohol consumption are risk factors of early-onset colorectal cancer
  9. Obesity is a risk factor for mortality from primary liver cancer
  10. Insufficiency of serum carotenoids increases overweight and obesity
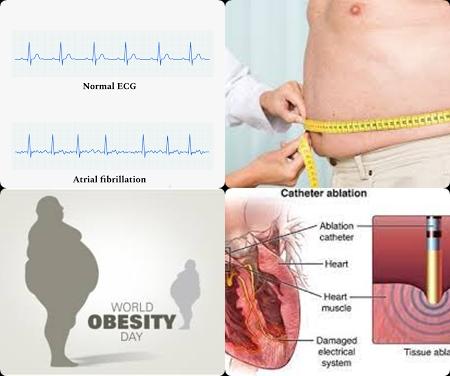
  11. Obesity increases atrial fibrillation recurrence in patients undergoing catheter ablation
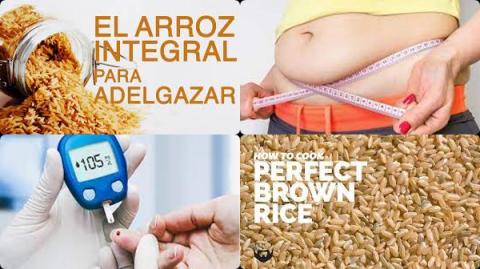
  12. Brown rice has anti-obesity effects in comparison with white rice
  13. No effect of vitamin E supplementation on weight, BMI and waist circumference
  14. Mortality is more frequently in COVID-19 patients with chronic kidney diseases and cardiovascular disease
  15. Vitamin D supplementation during pregnancy or infancy reduces adiposity in childhood

2020:

  1. Dairy products reduce causal fat mass and BMI among overweight or obese adults
  2. Pistachio supplementation lowers BMI without increasing body weight
  3. Abdominal adiposity is a risk factor in COVID-19
  4. Alpha-lipoic acid supplementation reduces weight and BMI
  5. Obesity increases severe COVID-19
  6. Coenzyme Q10 supplementation does not decrease body weight and BMI
  7. Yogurt intake is associated with a reduced risk of type 2 diabetes
  8. Fish consumption reduces metabolic syndrome
  9. Waist circumference is a significant risk factor of liver cancer

2019:

  1. A higher serum copper level increases obesity
  2. 100 g/d fruit consumption reduces metabolic syndrome
  3. 150 mg/day quercetin supplementation reduces LDL-cholesterol in obese people
  4. <2 g/d L-carnitine decreases diastolic blood pressure in participants with obesity
  5. 280 mg/d dietary calcium intake may reduce metabolic syndrome
  6. Adults with overweight/obesity benefit from probiotics
  7. ≤400 μg/d chromium supplementation reduce BMI
  8. Whole grains, fruit, nut, legume consumption reduce adiposity risk
  9. Tree nuts reduce risk of metabolic syndrome

2018:

  1. ≥75 mg/day isoflavones reduce BMI
  2. <50 g/d carbohydrates increase good cholesterol in overweight/obese adults
  3. ≥30g chocolate per day during 4-8 weeks reduce BMI
  4. Carotenoids may reduce risk of metabolic syndrome
  5. Ginger intake reduces body weight and fasting glucose among overweight and obese subjects
  6. Vegetable and fruit consumption reduce metabolic syndrome

2017:

  1. A low-fat diet reduces cholesterol level in overweight or obese people
  2. A high dietary fiber intake may reduce risk of metabolic syndrome
  3. A high fruit and/or vegetable consumption reduce risk of metabolic syndrome among Asian
  4. A high relative adipose mass reduces bone mineral density in overweight and obese populations
  5. Higher sodium increases metabolic syndrome
  6. Metabolic syndrome increases risk of ischemic stroke
  7. A higher circulating DHA is associated with a lower metabolic syndrome risk
  8. Whole flaxseed supplementation in doses ≥30 g/d during ≥12 weeks has positive effects on body composition in overweight participants
  9. n-3 PUFA supplements reduce waist circumference in overweight and obese adults
  10. Green tea decreases LDL cholesterol level in overweight or obese people
  11. Decreased vitamin D levels and increased BMI increase pediatric-onset MS
  12. CLA does not reduce fasting blood glucose and waist circumference
  13. Abdominal adiposity and higher body fat mass increase risk of atrial fibrillation

2015:

  1. Green tea consumption decreases blood pressure among overweight and obese adults

XXXXXXXXXXX

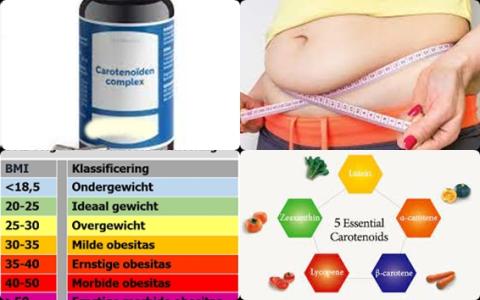
Overweight is an increasing problem in the world. It’s called overweight when the BMI is greater than 25 and obese when the BMI is greater than 30. A healthy weight has a BMI of 18.5-25. A woman with 65 kg and 1.57 meters has a BMI of 26.4 (65/(1.57x1.57)). BMI is weight divided by height squared (weight (kg)/height2 (m)).

The best way to determine overweight in children is to calculate the BMI. In adults, beside the BMI, waist circumference should also be measured.

Everybody who wants to lose weight, wants to burn more calorie at rest and more fat. How do you achieve these two goals?

Make sure the resting metabolic rate (RMR) does not decrease when following a diet (therefore, the recommendation of dietitians is no more than 0.5-1 kg of weight loss per week). A low resting metabolic rate will result in a low calorie burning at rest. But that is not what you want. You want, when following a diet, that the body will burn more calories (at rest).
A low resting metabolic rate is often the result of the insufficient intake of carbohydrate. When the body obtains insufficient quantities of carbohydrate, it’s been forced to get energy from protein, resulting in muscle degradation. Muscle degradation will in turn result in a lower resting metabolic rate. Muscle degradation can be observed when the upper arm and calf circumference become smaller. To prevent muscle degradation, when following a diet, is recommendable to choose product with 55-70 En% carbohydrates.

To prevent muscle degradation when following a diet, the diet must contain at least 1.6 g protein per kg body weight. For a person of 65 kg means 65x1.6 = 104 kg of protein per day. 1.6 g protein per kg body weight corresponds to a diet with 20 En% protein.

To prevent muscle degradation when following a diet, it is recommendable to choose products with 20-35 En% protein and/or products with 55-70 En% carbohydrates in combination with strength training. Strength training increases the resting metabolic rate. A declined resting metabolic rate is often the cause of the yo-yo effect.

Cardio-fitness is a good way to burn fat. To be able to burn fat efficiently, you should perform cardio-fitness with the heart rate between 75 and 90% of the maximum heart rate. The maximum heart rate is calculated by 220 minus age.
For example, you are 40 years old you have to perform cardio-fitness with a heart rate between 0.75-0.9x(220-40) = 135 and 162 heart beats per minute. Stop immediately  with the exercises when you are not feeling well or have pain in the chest!

In summary, it can be said the best way to lose weight is to perform strength training with cardio-fitness in combination with a diet containing products with 20-35 En% protein and/or products with 55-70 En% carbohydrates.

The main cause of overweight is the body gets more calories than it daily burns. Through physical activities, the body will burn more calories. To gain positive effects of physical exercises the body should burn at least 2000 calories (kcal) per week or at least 150 minutes of aerobic exercise of moderate intensity, accumulated over the week, which can be split into periods of at least 10 minutes. To prevent overweight, physical activities should account for 15-30% of the daily calorie intake.

The main consequences of overweight are:

  • Cardiovascular diseases.
  • Type 2 diabetes. The main effects of type 2 diabetes are cardiovascular diseases and kidney problems.

Belly fat is bad because it increases the risk of getting type 2 diabetes and cardiovascular disease. Therefore, aim for a waist circumference of 68-80 cm for women and 79-94 cm for men. A loss of 1 cm of belly fat (e.g. 95 to 94 cm) corresponds to a loss of 1 kg of fat. 1 kg of fat corresponds to 9000 calories.

Local fat loss, such as the backside or thighs is a scientific myth.

The human body will only burn fat when it meets the following two criteria:

  1. Increased oxygen uptake (only occurs during physical exercises).
  2. Increased energy demand (only occurs during physical exercises).

We like to eat fat but our body likes to use carbohydrates as energy source.

Overweight is the result of poor knowledge about nutrition in combination with hardly physical exercises.

It is not possible to lose more than 1.8 grams of fat per week. However, at more than 1 kg of fat loss per week, the body will also break down muscle, resulting in a low resting metabolic rate and yoyo-effect.

When following a diet is favorable to minimize fat through diet. But at least 7 grams of fat per day is necessary to ensure the intake of essential fatty acids and to stimulate the production of bile salts.
7 grams of fat per day corresponds to a daily diet with 4 En% fat. However, a diet with at least 20 En% fat (and up to 35 En% fat) is necessary to prevent a deficiency of essential fatty acids and fat-soluble vitamins on long-term.

A responsible breakfast contains up to 350 kcal.
A responsible lunch contains up to 450 kcal.
A responsible evening meal contains up to 750 kcal.

Good indicators for weight loss are a decreased body fat and an increased muscle mass. The body fat and muscle mass can be measured with a body composition analyzers scale.

Recommended daily energy intake by sex and age group
Age group (years)MenWomen
Kcal per dayKcal per day
616001500
1222002000
1729002300
30-3926002000
50-5925002000
70-7923001800
Others25002000


Recommended fat percentage by sex and age group
Age group (years)MenWomen
17-291525
30-3917.527.5
40-492030
50+2535
A healthy adult male has a body fat percentage around 15%.
A healthy adult woman has a body fat percentage around 25%.


Dietary guidelines for overweight prevention:

  • Choose products with 20-30 En% fat, products with maximum 7 En% saturated fat, products with 20-35% protein, products with maximum 10 En% sugars, products with minimum 1.5 grams of fiber per 100 kcal and products with a GI value of 55 or lower or in other words, your daily diet (=all meals/products that you eat on a daily basis) should on average contain 20-30 En% fat, maximum 7 En% saturated fat, 20-35% protein, maximum 10 En% sugars and minimum 1.5 grams of fiber per 100 kcal.
  • Products with 20-35 En% protein in combination with 10000 steps per day and 25-30 grams of fiber per day will reduce weight in a responsible manner.
    Products with 20-35 En% protein should contain maximum 30 En% fat and maximum 7 En% saturated fat!
  • No more than 0.5-1 kg of weight loss per week. 0.5 kg of weight loss per week corresponds to a decreased intake of 350 kcal per day through diet and 150 kcal extra through physical activities.
  • To prevent a deficiency of vitamins and essential fatty acids a diet should contain a minimum of 1700 kcal per day.
  • Increase the resting metabolic rate. Strength training is the best way to increase the resting metabolic rate.
  • Use the following guideline: total energy intake per day is 25-30 kcal per kg body weight.
  • Eat 300 grams of vegetables and five servings of fruit per day or 25-30 grams of fiber per day. Dietary fiber provides a longer satiety, resulting in less meal times during the day. Furthermore, the antioxidants from fruits and vegetables reduce inflammation.
    30 grams of fiber per day corresponds to a daily diet of minimum 1.5 grams of fiber per 100 kcal.
  • Eat no more than 19 grams of saturated fat per day at 2500 kcal and 15 grams of saturated fat at 2000 kcal. The WHO advises 2000 kcal per day for women and 2500 kcal for men.
  • Aim for a healthy weight. A healthy weight has a BMI of 18.5-25. BMI is weight divided by height squared (weight (kg)/height2 (m)).
  • Spend at least 90 minutes per day on physical exercises or at least 10000 steps per day.
  • Stop smoking because smoking causes atherosclerosis. Atherosclerosis is the most important cause of cardiovascular diseases.
  • Do not go shopping on an empty stomach.
  • Do not skip breakfast.
  • Put the meal on a small plate. So it looks like there is a lot of food on the plate!
  • Eat at least 2 times (100-150 g fish per time) a week oily fishes or take daily 250-500 mg EPA and DHA.
    Oily fishes are sardines, herring, salmon, anchovies, eel and mackerel.
  • Limit alcohol to 2 glasses for men and 1 glass for women per day.
  • Eat no more than 6 grams of salt per day, corresponding to 2400 mg of sodium.
    6 grams salt per day corresponds to a daily diet with <0.3 g salt per 100 kcal.
  • Do not take weight loss supplements. They do not what they claim.
Age (years)Recommended BMI for menRecommended BMI for women
414.40-17.5514.25-17.28
514.20-17.4214.05-17.15
614.04-17.5513.90-17.34
714.02-17.9213.94-17.75
814.10-18.4414.06-18.35
914.29-19.1014.26-19.07
1014.53-19.8414.57-19.86
1114.84-20.5514.99-20.74
1215.23-21.2215.52-21.68
1315.70-21.9116.13-22.58
1416.25-22.6216.73-23.34
1516.84-23.2917.28-23.94
1617.42-23.9017.75-24.37
1717.98-24.4618.16-24.70
18 and older18-50-25.0018.50-25.00

Diabetes

Scientific studies (review articles) on the relationship between diet/nutrients and diabetes prevention:
One swallow does not make a summer. A famous Dutch saying that could not be any more obvious. Just because one single scientific study about a certain topic makes certain claims, it does not necessarily mean it is true. On the other hand, a review article (a collection of scientific studies on a certain topic) of randomized, placebo-controlled double blind clinical trials (RCTs) will answer the following question:
"Do taking dietary supplements make sense?" Yes for a positive conclusion and no for a negative conclusion.

One swallow does not make a summer. A famous Dutch saying that could not be any more obvious. Just because one single scientific study about a certain topic makes certain claims, it does not necessarily mean it is true. On the other hand, a review article (a collection of scientific studies on a certain topic) of cohort studies or case-control studies will answer the following question:
"Should I change my diet?".

2022:

  1. 500 mg/d dietary flavonoid intake reduces cardiovascular disease, diabetes and hypertension
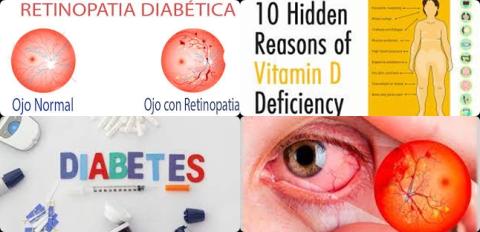
  2. Vitamin D deficiency increases blindness in people with diabetes
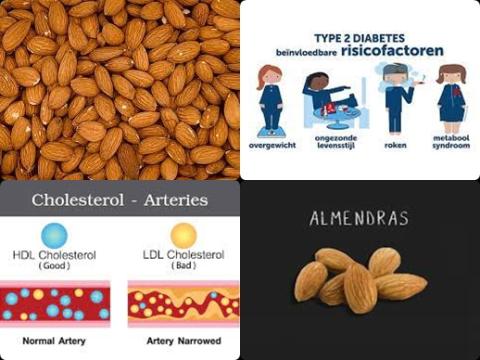
  3. 50 g/d almond decreases causally bad cholesterol in patients with type 2 diabetes
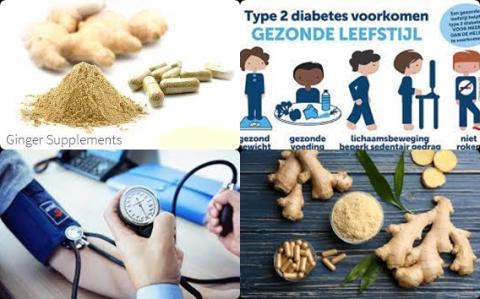
  4. Ginger supplementation reduces blood pressure in patients with type 2 diabetes

2021:

  1. Higher concentrations of carotenoids reduce type 2 diabetes
  2. Dietary sodium restriction causally reduces blood pressure in patients with type 2 diabetes mellitus
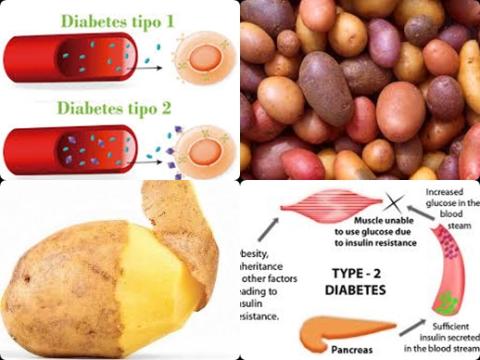
  3. Daily 80g potato increase type 2 diabetes among Western populations
  4. Vitamin C supplements improve triglyceride and cholesterol levels in patients with type 2 diabetes mellitus
  5. Spirulina supplementation reduces bad cholesterol among type 2 diabetes patients
  6. Grapes/grape products supplementation reduces HOMA-IR values in adults
  7. Intensive glucose control slows down cognitive decline in persons with type 2 diabetes
  8. Chromium supplementation improves lipid profile in patients with type 2 diabetes mellitus
  9. Patients with diabetes mellitus should be vaccinated against herpes zoster
  10. L-arginine supplements do not reduce diabetes in adults
  11. 1.5 g/day garlic supplementation reduces adiponectin level among participants ˂30 years
  12. Mortality is more frequently in COVID-19 patients with chronic kidney diseases and cardiovascular disease
  13. Peanut butter consumption may reduce type 2 diabetes
  14. Patients older than 60 years, with hypertension, diabetes and D-dimer values above 3.17 µg/mL have higher thrombotic events due to COVID-19
  15. Diet with <30 En% carbohydrates causally increases adiponectin concentration in adults
  16. 1.5 g/day EPA + DHA improve insulin sensitivity in children
  17. Oral vitamin C supplementation may improve glycemic control and blood pressure in people with type 2 diabetes
  18. Type 1 diabetes mellitus decreases bone mineral density in children and adolescents

2020:

  1. BCG vaccine should not be used in treatment of type 1 diabetes mellitus
  2. 2-3 servings/week fish reduce all-cause mortality in patients with type 2 diabetes
  3. Most prevalent comorbidities among COVID-19 are hypertension, diabetes, cardiovascular disease, liver disease, lung disease, malignancy, cerebrovascular disease, COPD and asthma
  4. Vitamin B3 supplementation increases good cholesterol in patients with type 2 diabetes mellitus
  5. Patients with diabetes should be advised to continue taking metformin drugs despite COVID-19 infection status
  6. Daily 8.4-10 grams of inulin supplements for at least 8 weeks improve risk factors of type 2 diabetes
  7. Male, age, cardiovascular disease, hypertension and diabetes mellitus increase mortality in patients with COVID-19
  8. Diabetes mellitus is associated with severe infection and mortality in patients with COVID-19
  9. Barberry supplementation improves insulin levels
  10. Diabetes increases in-hospital mortality in patients with COVID-19
  11. Daily 40g soy consumption for <12 weeks increase IGF-1 level
  12. 100 mg/day magnesium dietary intake reduce type 2 diabetes
  13. 50g/day processed meat increase type 2 diabetes
  14. Yogurt intake is associated with a reduced risk of type 2 diabetes
  15. Hypertension, diabetes, COPD, cardiovascular disease and cerebrovascular disease are major risk factors for patients with COVID-19
  16. Hypertension, cardiovascular diseases, diabetes mellitus, smoking, COPD, malignancy and chronic kidney disease are risk factors for COVID-19 infection
  17. Omega-3 fatty acids + vitamin E or D reduce gestational diabetes
  18. Psyllium consumption improves risk factors of diabetes
  19. Soy protein dietary intake reduces type 2 diabetes

2019:

  1. Elevated serum/plasma zinc concentration increases risk of type 2 diabetes
  2. 100mg magnesium dietary intake reduce type 2 diabetes
  3. Consumption of tree nuts decreases HOMA-IR and fasting insulin levels
  4. Low-fat dairy products have a beneficial effect on HOMA-IR, waist circumference and body weight
  5. Whole grain and cereal fiber dietary intake reduce type 2 diabetes
  6. Dietary low-ratio n-6/n-3 PUFA supplementation improves insulin resistance in diabetic patients
  7. Zinc supplementation reduces diabetes mellitus
  8. Moderate plant protein decreases type 2 diabetes mellitus
  9. Probiotic and synbiotic supplementation reduce inflammation in diabetic patients
  10. Folate supplementation lowers HOMA-IR
  11. 13.1 g/day viscous fiber supplements improve glycemic control

2018:

  1. 1 serving/day potato increases risk type 2 diabetes
  2. 150 g/day French-fries consumption increases risk of hypertension
  3. Garlic increases good cholesterol in diabetic patients
  4. High intake of cereal fiber may reduce type 2 diabetes
  5. Ginger intake reduces body weight and fasting glucose among overweight and obese subjects
  6. Animal protein increases risk of type 2 diabetes
  7. ≥550 mg/day flavonoids intake reduce type 2 diabetes
  8. High-fat diets increase risk of type 2 diabetes
  9. Folic acid supplementation reduces both fasting glucose level, fasting insulin level and HOMA-IR
  10. Low-GI diet is good for patients with type 2 diabetes
  11. Vitamin K supplementation has no effect on glycemic control
  12. Daily 3 mg L-carnitine during 12 weeks reduce serum leptin concentrations in diabetic patients

2017:

  1. Each 1 mmol/L increase in serum potassium reduces type 2 diabetes mellitus by 17%
  2. Fish oil supplementation during <12 weeks improves insulin sensitivity among people with metabolic disorders
  3. Atrial fibrillation, previous stroke, myocardial infarction, hypertension, diabetes and previous TIA increase risk of post-stroke dementia
  4. Pomegranate supplementation has no favourable effect on improvements in glucose and insulin metabolism
  5. Low carbohydrate diet decreases type 2 diabetes
  6. A diet with 4.4 g/day alpha-linolenic acid during 3 months does not reduce level of HbA1c, FBG or FBI in patients with type 2 diabetes
  7. Vegetarian diet has a protective effect against diabetes risk
  8. Weekly 30-180 gram chocolate consumption reduces risk of coronary heart disease, stroke and diabetes
  9. Probiotics supplementation improves HbA1c and fasting insulin in type 2 diabetes patients
  10. Vitamin K supplementation does not reduce diabetes
  11. A higher consumption of whole grains, fruits and dairy products reduces type 2 diabetes risk
  12. A diet of below 45 En% carbohydrate during 3 to 6 months reduces HbA1c level of patients with type 2 diabetes
  13. Vitamin C supplementation for at least 30 days reduces glucose concentrations in patients with type 2 diabetes
  14. Magnesium supplementation reduces risk of cardiovascular disease among type 2 diabetes
  15. Weekly one serving of apple and pear reduces type 2 diabetes mellitus risk
  16. Reduced serum levels of folate and vitamin B12 increase peripheral neuropathy risk among patients with type 2 diabetes
  17. Vitamin C and D reduce blood pressure in patients with type 2 diabetes

2016:

  1. A higher intake of plant protein decreases risk of type 2 diabetes among women

2015:

  1. Garlic supplementation during 12 weeks reduces fasting blood glucose

2014:

  1. Exercise lowers the risk for diabetes conferred by insulin resistance
  2. 1-6 cups/day caffeinated or decaffeinated coffee is associated with reduced type 2 diabetes risk
  3. Exercise training helps to prevent and to treat type 2 diabetes in youth
  4. At least 25g dietary fiber intake per day reduces risk of type 2 diabetes
  5. Niacin supplementation reduces LDL cholesterol levels in patients with type 2 diabetes mellitus

2012:

Diabetes increases risk of dementia and mild cognitive impairment

XXXXXXXXXX

The human body wants the blood glucose (blood sugar) level maintained in a very narrow range of 4 to 8 mmol/l. Insulin and glucagon are the hormones which make this happen. Both insulin and glucagon are secreted from the pancreas.

When the blood glucose level drops below 4 mmol/l (after physical exercise or on awakening) the alpha cells of the pancreas release glucagon. Glucagon converts glycogen into glucose. The glucose is released into the bloodstream, increasing blood sugar levels.
On the other hand, when the blood glucose level rises above 8 mmol/l, whether as a result of glycogen conversion or from digestion of a meal, insulin is released from beta cells of the pancreas. This hormone causes the liver to convert more glucose into glycogen and to force about 2/3 of body cells to take up glucose from the bloodstream through the GLUT4 transporter, thus decreasing blood sugar levels.

Diabetes mellitus describes a group of chronic metabolic diseases in which the person has a high blood glucose level, either because insulin production is inadequate or because the body's cells do not respond properly to insulin (also called insulin resistance) or both. Diabetes can be divided into two types: type 1 and type 2.

Type 1 diabetes:
The human body does not produce insulin. This type of diabetes is also called insulin-dependent diabetes, juvenile diabetes or early-onset diabetes. People usually develop type 1 diabetes before their 40th year, often in early adulthood or teenage years.

Patients with type 1 diabetes will need to take insulin injections for the rest of their life. They must also ensure proper blood-glucose levels by carrying out regular blood tests and following a special diet. Type 1 diabetes is not curable and is generally a form which is less common than type 2.

Type 2 diabetes:
In type 2 diabetes the body does not respond properly to insulin. Type 2 diabetes occurs mainly in the elderly and in people who are overweight (BMI>25). The treatment of type 2 diabetes is the first of dietary advice in conjunction with achieving a healthy weight (BMI = 18.5-25). Unlike type 1, type 2 is curable. Type 2 diabetes is also referred to as non-insulin-dependent diabetes mellitus.

Approximately 90% of all cases of diabetes worldwide are of this type.

These are the consequences that many diabetics may experience:

  • Amputation of limbs
  • Depression
  • Heart diseases
  • Skin problems
  • Gastrointestinal problems
  • Kidney disease
  • Eye problems
  • Problems of the joints
  • Problems with brains
  • Sexual problems
  • Foot problems
  • Nerves disorders

Dietary guidelines for diabetes prevention:

  • Choose products with minimum 1.5 grams of fiber per 100 kcal, products with maximum 30 En% fat, products with maximum 7 En% saturated fat, products with 10-20 En% protein, products with maximum 10 En% sugars and products with a low GI value (55 or lower) or in other words, your daily diet (=all meals/products that you eat on a daily basis) should on average contain minimum 1.5 grams of fiber per 100 kcal, maximum 30 En% fat, maximum 7 En% saturated fat, 10-20 En% protein and maximum 10 En% sugars.
  • Aim for a healthy weight. A healthy weight has a BMI of 18.5-25. BMI is weight divided by height squared (weight (kg)/height2 (m)).
  • Spend at least 60-90 minutes of physical activities per day or at least 10000 steps per day.
  • Eat at least 3 times (100-150 g fish per time) a week oily fish. Oily fishes are sardines, herring, salmon, anchovies, eel and mackerel. Oily fish contains more EPA and DHA than non-oily fish.
  • Eat 300 grams of vegetables and five servings of fruit a day or 30-40 grams of fiber per day.
    40 grams of fiber per dag corresponds to a daily diet of minimum 2 grams of fiber per 100 kcal.
  • Eat plenty of whole grains, such as brown bread and oatmeal and legumes.
  • Limit to 2-3 glasses of alcohol for men and 1-2 glasses for women a day or <30 g alcohol per day.

Causal relationship between sugar-sweetened beverages consumption and higher BMI and body weight

Afbeelding

Objectives:
Is there a causal relationship between sugar-sweetened beverages consumption and higher BMI and body weight in both children and adults?
 
Study design:
This review article included 85 studies with 48 in children (40 cohort studies with 91,713 participants and 8 RCTs with 2,783 participants) and 37 in adults (21 cohort studies with 448,661 participants and 16 RCTs with 1,343 participants).

Results and conclusions:
The investigators found among cohort studies, each serving/day increase in sugar-sweetened beverages intake was significantly associated with a 0.07 kg/m2 [95% CI = 0.04 to 0.10 kg/m2] higher BMI in children and a 0.42 kg [95% CI = 0.26 to 0.58 kg] higher body weight in adults.

The investigators found RCTs in children indicated less BMI gain with sugar-sweetened beverages reduction interventions compared with control [MD = -0.21 kg/m2, 95% CI = -0.40 to -0.01 kg/m2].

The investigators found RCTs in adults showed randomization to addition of sugar-sweetened beverages to the diet led to greater body weight gain [MD = 0.83 kg, 95% CI = 0.47 to 1.19 kg] and subtraction of sugar-sweetened beverages led to weight loss [MD = -0.49 kg, 95% CI = -0.66 to -0.32 kg] compared with the control groups.

The investigators found a positive linear dose-response association between sugar-sweetened beverages consumption and weight gain for all outcomes assessed.

The investigators concluded there is a causal relationship between sugar-sweetened beverages consumption and higher BMI and higher body weight in both children and adults.

Original title:
Sugar-sweetened beverage consumption and weight gain in children and adults: a systematic review and meta-analysis of prospective cohort studies and randomized controlled trials by Nguyen M, Jarvis SE, [...], Malik VS.

Link:
https://pubmed.ncbi.nlm.nih.gov/36789935/

Additional information of El Mondo:
Find more information/studies on sugar-sweetened beverages consumption and obesity/overweight right here.

Vitamin D deficiency increases blindness in people with diabetes

Afbeelding

Objectives:
Vitamin D levels have been shown to be associated with diabetic retinopathy, however to date, no review has examined the relationship between vitamin D and sight threatening diabetic retinopathy (STDR) and non-sight threatening diabetic retinopathy (NSTDR). Therefore, this review article has been conducted. 

Does vitamin D deficiency (defined as 25(OH)D levels of 20 ng/mL) increase risk of diabetic retinopathy in patients with diabetes?

Study design:
This review article included 11 cross-sectional studies and 1 case-control study with a total of  9,057 participants.
There was no publication bias.

Results and conclusions:
The investigators found vitamin D deficiency significantly increased risk of sight threatening diabetic retinopathy with 80% [OR = 1.80, 95% CI = 1.40 to 2.30, p ≤ 0.001, I2 = 39.39%].
However, this increased risk was not found for non-sight threatening diabetic retinopathy [OR = 1.10, 95% CI = 0.90 to 1.27, p = 0.48, I2 = 30.21%].

The investigators concluded that vitamin D deficiency (defined as 25(OH)D levels of 20 ng/mL)  increases risk of sight threatening diabetic retinopathy but not non-sight threatening diabetic retinopathy. Given the well-reported associations between vitamin D deficiency and other unfavourable outcomes, it is important that vitamin D deficiency is managed appropriately and in a timely manner to reduce the risk of blindness in people with diabetes.

Original title:
Associations between vitamin D status and sight threatening and non-sight threatening diabetic retinopathy: a systematic review and meta-analysis by Trott M, Driscoll R, […], Pardhan S.

Link:
https://www.ncbi.nlm.nih.gov/pmc/articles/PMC9167360/

Additional information of El Mondo:
Find more information/studies on vitamin D and diabetes right here.

Diabetic retinopathy, also known as diabetic eye disease (DED), is a complication of diabetes, caused by high blood sugar levels damaging the back of the eye (retina). It can cause blindness if left undiagnosed and untreated.


50 g/d almond decreases causally bad cholesterol in patients with type 2 diabetes

Afbeelding

Objectives:
An enhanced risk for cardiovascular disease (CVD) still exists even when patients with type 2 diabetes have tight control on blood sugar. Thus, identification of treatment approaches that address CVD risk factors may be useful for patients beyond the blood sugar management. Although emerging evidence suggests that nuts consumption have beneficial effects on cardiometabolic health, the effects of almond intake in patients with type 2 diabetes are still controversial. Therefore, this review article has been conducted. 

Does almond consumption improve risk factors (cholesterol, triglycerides, fasting plasma glucose, insulin, hemoglobin A1c (HbA1c), body mass index, weight, body fat, systolic and diastolic blood pressure and CRP) of cardiovascular disease in patients with type 2 diabetes?

Study design:
This review article included 9 RCTs.

Results and conclusions:
The investigators found there was a causal relationship between almond dietary intake and a  significant reduction in low-density lipoprotein cholesterol (LDL cholesterol or bad cholesterol) [WMD = -5.28 mg/dL, 95% CI = -9.92 to -0.64, p = 0.026] in patients with type 2 diabetes compared with the control group.
This lowering effect of LDL cholesterol was robust in subgroups with almond consumption >50 g/day and baseline LDL cholesterol level 130 mg/dL.

The investigators found, however, the effect of almond on total cholesterol, triglycerides, high-density lipoprotein cholesterol (HDL cholesterol or good cholesterol), fasting plasma glucose, insulin, HbA1c, body mass index, weight, body fat, systolic and diastolic blood pressure and CRP was not significant compared with the control group.

The investigators concluded that a dietary intake of at least 50 g/d almond decreases causally LDL cholesterol (bad cholesterol) but has no favourable effect on other cardiometabolic outcomes in patients with type 2 diabetes. Further high-quality studies are needed to firmly establish the clinical efficacy of the almond.

Original title:
Effects of almond on cardiometabolic outcomes in patients with type 2 diabetes: A systematic review and meta-analysis of randomized controlled trials by Moosavian SP, Rahimlou M, […], Jalili C.

Link:
https://pubmed.ncbi.nlm.nih.gov/35443097/

Additional information of El Mondo:
Find more information/studies on almond consumption and diabetes right here.
 

Ginger supplementation reduces blood pressure in patients with type 2 diabetes

Afbeelding

Objectives:
There is some evidence regarding the positive effects of ginger supplementation on metabolic profile in patients with type 2 diabetes (T2DM). However, they are conflicting and therefore, this review article has been conducted. 

Does ginger supplementation improve metabolic profile (FBS, HbA1c, TC, TG, LDL, HDL, SBP and DBP) in patients with type 2 diabetes?

Study design:
This review article included 10 RCTs.

Results and conclusions:
The investigators found pooled meta-analysis showed a significant reduction in fasting blood sugar (FBS) level following ginger supplementation by polling 8 effect sizes [WMD = -18.81, 95% CI = -28.70 to -8.92, I2 = 77.4%].

The investigators found pooled meta-analysis showed a significant reduction in HbA1c level following ginger supplementation by polling 7 effect sizes [WMD = -0.57, 95% CI = -0.93 to -0.20, I2 = 88.6%].

The investigators found pooled meta-analysis showed a significant reduction in systolic blood pressure (SBP) following ginger supplementation by polling 5 effect sizes [WMD = -4.20, 95% CI = -7.64 to -0.77, I2 = 97%].

The investigators found pooled meta-analysis showed a significant reduction in diastolic blood pressure (DBP) following ginger supplementation by polling 5 effect sizes [WMD = -1.61, 95% CI = -3.04 to -0.18, I2 = 93.2%].

The investigators found pooled meta-analysis showed ginger supplementation had no significant influence on lipid profile involving triglyceride (TG), total cholesterol (TC), LDL cholesterol and HDL cholesterol.

The investigators concluded supplementation with ginger reduces fasting blood sugar, HbA1c, systolic blood pressure and diastolic blood pressure in patients with type 2 diabetes. Further large RCTs are required to shed light on this issue.

Original title:
The effect of ginger supplementation on metabolic profiles in patients with type 2 diabetes mellitus: A systematic review and meta-analysis of randomized controlled trials by Ebrahimzadeh A, Ebrahimzadeh A, […], Milajerdi A.

Link:
https://pubmed.ncbi.nlm.nih.gov/35031435/

Additional information of El Mondo:
Find more information/studies on lowering blood pressure and diabetes right here.
 

High protein diets causally have beneficial effect on body weight management

Afbeelding

Objectives:
Do diets rich in protein causually reduce body weight of adults with overweight or obesity? 

Study design:
This review article included 37 RCTs.
The diets were included during a mean of 32 weeks interventions, ranging from 8 to 104 weeks.

There was no publication bias.

Results and conclusions:
The investigators found protein intake (ranging from 18-59 energy percentage [En%]) significantly reduced body weight by 1.6 kg [95% CI = 1.2 to 2.0 kg, I2 = 56%] compared to controls (digestible carbohydrate, fiber, fat or no supplementation (no placebo used)).
This result was also found in sensitivity analysis.

The investigators found the effect size of dietary protein in body weight management was dependent on specific phenotypes, where individuals with prediabetes had more benefit compared to individuals with normoglycemia.
Furthermore, individuals without the obesity risk allele (AA genotype) had more benefit compared to individuals with the obesity risk alleles (AG and GG genotypes).

The investigators concluded that diets rich in protein (18-59 energy percentage [En%]) during 32 weeks causally have a moderate beneficial effect on body weight management of adults with overweight or obesity.

Original title:
Are Dietary Proteins the Key to Successful Body Weight Management? A Systematic Review and Meta-Analysis of Studies Assessing Body Weight Outcomes after Interventions with Increased Dietary Protein by Hansen TT, Astrup A and Sjödin A.

Link:
https://www.ncbi.nlm.nih.gov/pmc/articles/PMC8468854/

Additional information of El Mondo:
Find more information/studies on protein consumption and overweight right here.

A diet rich in protein with 18-59 energy percentage [E%] or a diet with 18-59 En% protein means that the amounts of protein contribute 18 to 59% to the total calories (kcal) of the diet.
If the diet contains 2000 kcal, 90 grams of protein contribute 18% to this 2000 kcal.
1 gram of protein gives 4 kcal. Thus 90 grams of protein provide 360 kcal (90x4 kcal) and 360 kcal is 18% of 2000 kcal.

The most easy way to follow a diet rich in protein with 18-59 energy percentage is to choose only meals/products with 18-59 En% protein. Check here which products contain 18-59 En% protein.

However, the most practical way to follow a diet with 18-59 En% protein is, all meals/products that you eat on a daily basis should contain on average 18-59 En% protein.

To do this, use the 7-points nutritional profile app to see whether your daily diet contains 18-59 En% protein.

A high-protein diet is a diet with at least 20 En% protein.


High circulating vitamin C level reduces metabolic syndrome

Objectives:
The association between vitamin C and metabolic syndrome (MetS) has been evaluated in several epidemiological studies with conflicting results. Therefore, this review article has been conducted.

Do dietary vitamin C intake and circulating vitamin C level reduce risk of metabolic syndrome? 

Study design:
This review article included 26 cross-sectional studies and 2 cohort studies with a total number of 110,771 participants. 23 studies were related to the dietary vitamin C level.
The sample size ranged from 143 to 27,656 persons.
The dietary vitamin C level was assessed by food-frequency questionnaire (FFQ) in 4 studies, a 24-h or 3-day recall in 18 studies and a 4-day record in 1 study.

No evidence of publication bias existed according to Begg's rank correlation test [p = 0.495].

Results and conclusions:
The investigators found when compared to the lowest dietary vitamin C intake, that the highest dietary vitamin C intake significantly reduced risk of metabolic syndrome with 7% [overall multivariable-adjusted RR = 0.93, 95% CI = 0.88 to 0.97, p = 0.003, I2 = 54.5%, p = 0.003]. The above findings were confirmed in cross-sectional studies [RR = 0.92, 95% CI = 0.87 to 0.97, p = 0.001] and 24-h or 3-day recall [RR = 0.89, 95% CI = 0.86 to 0.93, p 0.001] studies.

The investigators found when compared to the lowest circulating vitamin C level, that the highest circulating vitamin C level significantly reduced risk of metabolic syndrome with 40% [overall multivariable-adjusted RR = 0.60, 95% CI = 0.49 to 0.74, p 0.001, I2 = 22.7%, p = 0.249].

The investigators concluded that both the dietary and the circulating vitamin C level reduce risk of metabolic syndrome. However, due to the limitation of the available evidence, more well-designed prospective studies are still needed.

Original title:
Vitamin C and Metabolic Syndrome: A Meta-Analysis of Observational Studies by Guo H, Ding J, [...], Zhang Y.

Link:
https://www.ncbi.nlm.nih.gov/pmc/articles/PMC8531097/

Additional information of El Mondo:
Find more information/studies on vitamin C consumption and overweight right here.

In practice, a lot of dietary vitamin C intake amounts to 200 to 300 grams of vegetables and 2-5 pieces of fruit per day. Vitamin C is found in fruit and vegetables.

A high circulating vitamin C level can be obtained through vitamin C-rich food and/or taking vitamin C supplements.


Carbohydrate intake increases metabolic syndrome

Afbeelding

Objectives:
The associations between dietary carbohydrate and diverse health outcomes remain controversial and confusing. Therefore, this review article (meta-analyse) has been conducted.

What is the association between dietary carbohydrate intake and diverse health outcomes?

Study design:
This review article included 43 meta-analyses of observational research studies with 23 health outcomes, including cancer (n = 26), mortality (n = 4), metabolic diseases (n = 4), digestive system outcomes (n = 3) and other outcomes [coronary heart disease (n = 2), stroke (n = 1), Parkinson's disease (n = 1) and bone fracture (n = 2)].

This umbrella review summarized 281 individual studies with 13,164,365 participants.

33.3% studies were considered to be of high quality and 66.7% of moderate quality.

Results and conclusions:
The investigators found highly suggestive evidence showed that dietary carbohydrate intake significantly increased risk of metabolic syndrome with 25% [adjusted summary odds ratio = 1.25, 95% CI = 1.15 to 1.37].

The investigators found suggestive evidence showed that dietary carbohydrate intake significantly decreased risk of esophageal adenocarcinoma with 43% [adjusted summary hazard ratio = 0.57, 95% CI = 0.42 to 0.78].

The investigators found suggestive evidence showed that dietary carbohydrate intake significantly increased risk of all-cause mortality with 19% [adjusted summary hazard ratio 1.19, 95% CI = 1.09 to 1.30].

The investigators concluded despite the fact that numerous systematic reviews and meta-analyses have explored the relationship between carbohydrate intake and diverse health outcomes, there is no convincing evidence of a clear role of carbohydrate intake. However, highly suggestive evidence shows carbohydrate intake is associated with higher risk of metabolic syndrome. Suggestive evidence shows carbohydrate intake is associated with higher risk of all-cause mortality and lower risk of esophageal adenocarcinoma.

Original title:
Dietary Carbohydrate and Diverse Health Outcomes: Umbrella Review of 30 Systematic Reviews and Meta-Analyses of 281 Observational Studies by Liu YS, Wu QJ […], Zhao YH.

Link:
https://www.ncbi.nlm.nih.gov/pmc/articles/PMC8116488/

Additional information of El Mondo:
Find more information/studies on carbohydrate consumption and obesity/overweight right here.

Higher concentrations of carotenoids reduce type 2 diabetes

Afbeelding

Objectives:
Previous meta-analysis studies have indicated inverse associations between some carotenoids and risks of metabolic syndrome, cardiovascular disease, cancer and all-cause mortality. However, the results for associations between carotenoids and type 2 diabetes (T2D) remain inconsistent and no systematic assessment has been done on this topic. Therefore, this review article (meta-analysis) has been conducted.

Do higher dietary intakes and circulating concentrations of carotenoids reduce risk of type 2 diabetes?

Study design:
This review article included 13 studies.

Results and conclusions:
The investigators found for the the highest versus the lowest categories of dietary intake of β-carotene a significantly reduced risk of 22% for type 2 diabetes [pooled RR = 0.78, 95% CI = 0.70 to 0.87, I2 = 13.7%, n = 6].
This significantly reduced risk was also found for total carotenoids (n = 2), α-carotene (n = 4), and lutein/zeaxanthin (n = 4), with pooled RRs ranging from 0.80 to 0.91, whereas no significant associations were observed for β-cryptoxanthin and lycopene.

The investigators found for the the highest versus the lowest categories of circulating concentration of β-carotene a significantly reduced risk of 40% for type 2 diabetes [pooled RR = 0.60, 95% CI = 0.46 to 0.78, I2 = 56.2%, n = 7].
This significantly reduced risk was also found for total carotenoids (n = 3), lycopene (n = 4), and lutein (n = 2), with pooled RRs ranging from 0.63 to 0.85, whereas no significant association was found for circulating concentrations of α-carotene and zeaxanthin when comparing extreme categories.

The investigators found dose-response analysis indicated that nonlinear relations were observed for circulating concentrations of α-carotene, β-carotene, lutein and total carotenoids [all p-nonlinearity 0.05], but not for other carotenoids or dietary exposures.

The investigators concluded that higher dietary intakes and circulating concentrations of total carotenoids, especially β-carotene, are associated with a lower risk of type 2 diabetes. More studies are needed to confirm the causality and explore the role of foods rich in carotenoids in prevention of type 2 diabetes.

Original title:
Dietary Intake and Circulating Concentrations of Carotenoids and Risk of Type 2 Diabetes: A Dose-Response Meta-Analysis of Prospective Observational Studies by Jiang YW, Sun ZH, [...], Pan A.

Link:
https://pubmed.ncbi.nlm.nih.gov/33979433/

Additional information of El Mondo:
Find more information/studies on carotenoids and diabetes right here.


Poultry consumption decreases metabolic syndrome

Afbeelding

Objectives:
What is the association between red meat and poultry consumption and the risk of metabolic syndrome?

Study design:
This review article included 9 prospective cohort studies, which involved a total of 21,869 participants.
Among them, 8 studies were identified for red meat consumption.

No publication bias was observed according to the Begg's rank-correlation test and the Egger's test.  

Results and conclusions:
The investigators found that red meat consumption was significantly associated with a higher risk of 35% for metabolic syndrome [multi-variable adjusted RR = 1.35, 95% CI = 1.13 to 1.62, p = 0.001, I2 = 54.4%, p = 0.032].  
The same results were obtained in subgroup analysis for >5 years follow-up [RR = 1.36, 95% CI = 1.09 to 1.7, p = 0.006], non-National Cholesterol Education Program-Adult Treatment Panel (NCEP-ATP III) [RR = 1.34, 95% CI = 1.12 to 1.62, p = 0.002], Non-Asia [RR = 1.51, 95% CI = 1.29 to 1.77, p 0.001], adjustment of BMI [RR = 1.4, 95% CI = 1.23 to 1.6, p 0.001] and physical activity studies [RR = 1.48, 95% CI = 1.29 to 1.71, p 0.001].

The investigators found that unprocessed red meat consumption was significantly associated with a higher risk of 32% for metabolic syndrome [multi-variable adjusted RR = 1.32, 95% CI = 1.14 to 1.54, p = 0.0003, I2 = 0%, p = 0.397].  

The investigators found that processed red meat consumption was significantly associated with a higher risk of 48% for metabolic syndrome [multi-variable adjusted RR = 1.48, 95% CI = 1.11 to 1.97, p = 0.007, I2 = 64.7%, p = 0.097].  

The investigators found that poultry consumption was significantly associated with a lower risk of 15% for metabolic syndrome [multi-variable adjusted RR = 0.85, 95% CI = 0.75 to 0.97, p = 0.02, I2 = 0%, p = 0.707].  

The investigators concluded that red meat (processed and unprocessed) consumption is associated with a higher risk of metabolic syndrome, whereas, poultry consumption is associated with a lower risk of metabolic syndrome. More well-designed randomized controlled trials are still needed to address the issues further.

Original title:
Association of Red Meat and Poultry Consumption With the Risk of Metabolic Syndrome: A Meta-Analysis of Prospective Cohort Studies by Guo H, Ding J, [...], Zhang Y.

Link:
https://www.ncbi.nlm.nih.gov/pmc/articles/PMC8295459/

Additional information of El Mondo:
Find more information/studies on meat consumption and obesity/overweight right here.

Nut consumption does not increase adiposity

Afbeelding

Objectives:
Nuts are recommended for cardiovascular health, yet concerns remain that nuts may contribute to weight gain due to their high energy density. Therefore, this review article has been conducted.

Does nut consumption contribute to an increased adiposity risk?

Study design:
This review article included 6 prospective cohort studies with 569,910 participants and 86 RCTs with 114 comparisons and 5,873 participants.

Results and conclusions:
The investigators found nuts consumption was significantly associated with a lower risk of 7% for incidence of overweight/obesity [RR = 0.93, 95% CI = 0.88 to 0.98, p 0.001, moderate certainty of evidence] in prospective cohort studies.

The investigators found RCTs showed no adverse effect of nuts on body weight [MD = 0.09 kg, 95% CI = -0.09 to 0.27 kg, p 0.001, high certainty of evidence].

The investigators found meta-regression showed that higher nut intake was significantly associated with reductions in body weight and body fat.

The investigators concluded that current evidence demonstrates the concern that nut consumption contributes to increased adiposity appears unwarranted.

Original title:
Are fatty nuts a weighty concern? A systematic review and meta-analysis and dose-response meta-regression of prospective cohorts and randomized controlled trials by Nishi SK, Viguiliouk E, [...], Sievenpiper JL.

Link:
https://pubmed.ncbi.nlm.nih.gov/34494363/

Additional information of El Mondo:
Find more information/studies on nut consumption and obesity/overweight right here.

Dietary sodium restriction causally reduces blood pressure in patients with type 2 diabetes mellitus

Afbeelding

Objectives:
Although current guidelines recommend reduction of salt intake in patients with diabetes, the benefits of reducing salt intake in people with type 2 diabetes mellitus (T2DM) lack clear evidence. Therefore, this review articles has been conducted.

Does dietary sodium restriction causally reduce blood pressure in patients with type 2 diabetes mellitus (T2DM)?

Study design:
This review article included 8 RCTs with 10 trials (7 cross-over and 3 parallel designs).
No publication bias was found from Begg's and Egger's tests.

Results and conclusions:
The investigators found compared with ordinary sodium intake, dietary sodium restriction significantly decreased 24-hour urine sodium level [WMD = -38.430 mmol/24h, 95% CI = -41.665 mmol/24h to -35.194 mmol/24h].

The investigators found dietary sodium restriction significantly lowered systolic blood pressure [WMD = -5.574 mm Hg, 95% CI = -8.314 to -2.834 mm Hg, I2 = 0.0%] and diastolic blood pressure [WMD = -1.675 mm Hg, 95% CI = -3.199 to -0.150 mm Hg, I2 = 0.0%].

The investigators concluded that dietary sodium restriction causally reduces systolic blood pressure and diastolic blood pressure in patients with type 2 diabetes mellitus (T2DM).

Original title:
Effect of dietary sodium restriction on blood pressure in type 2 diabetes: A meta-analysis of randomized controlled trials by Ren Y, Liqiang Qin L, […], Ma Y.

Link:
https://pubmed.ncbi.nlm.nih.gov/33838996/

Additional information of El Mondo:
Find more information/studies on sodium and diabetes right here.

Salt consists of sodium and chloride. So a dietary sodium restriction means a reduction in dietary salt intake.

A diet with dietary salt restriction is a diet with maximum 0.2 grams of salt per 100 kcal.

The easiest way to follow this diet is to choose only products/meals with maximum 0.2 grams of salt per 100 kcal. These products from the supermarket contain maximum 0.2 grams of salt per 100 kcal.

However, the most practical way to follow this diet is, all your daily consumed products/meals should contain on average maximum 0.2 grams of salt per 100 kcal.
To do this, use the 7-points nutritional profile app to see if your daily diet contains maximum 0.2 grams of salt per 100 kcal.

Daily 80g potato increase type 2 diabetes among Western populations

Afbeelding

Objectives:
Evidence regarding associations between potato consumption and type 2 diabetes (T2D) and gestational diabetes mellitus (GDM) risks is accumulating. Therefore, this review article has been conducted.

Does a high potato intake increase type 2 diabetes and gestational diabetes mellitus (diabetes mellitus during pregnancy) risk?

Study design:
This review article included 19 studies (13 for type 2 diabetes and 6 for gestational diabetes mellitus) with a total of 21,357 type 2 diabetes cases among 323,475 participants and 1,516 gestational diabetes mellitus cases among 29,288 pregnancies.

Results and conclusions:
The investigators found meta-analysis showed a significantly increased risk of 19% [RR = 1.19, 95% CI = 1.06 to 1.34] for type 2 diabetes for total potato intakes among Western populations.

The investigators found meta-analysis showed a significantly increased risk of 8% [RR = 1.08, 95% CI = 1.00 to 1.16] for type 2 diabetes for baked/boiled/mashed potato intakes among Western populations.

The investigators found meta-analysis showed a significantly increased risk of 33% [RR = 1.33, 95% CI = 1.03 to 1.70] for type 2 diabetes for French fries/fried potato intakes among Western populations.

The investigators found dose-response meta-analysis demonstrated a significantly increased type 2 diabetes risk by 10% [95% CI = 1.07 to 1.14, p for trend 0.001], 2% [95% CI = 1.00 to 1.04, p for trend = 0.02] and 34% [95% CI = 1.24 to 1.46, p for trend 0.001] among Western populations for each 80 g/day (serving) increment in total potato, unfried potato and fried potato intakes, respectively.

The investigators found dose-response meta-analysis demonstrated a significantly increased gestational diabetes mellitus risk by 22% [95% CI = 1.06 to 1.42, p for trend 0.007] among Western populations for each 80 g/day (serving) increment in total potato intakes.

The investigators found dose-response meta-analysis demonstrated a significantly increased gestational diabetes mellitus risk by 26% [95% CI = 1.07 to 1.48, p for trend = 0.006] among Western populations for each 80 g/day (serving) increment in unfried potato intakes.

The investigators concluded that higher potato intake (at least 80g per day) is associated with higher type 2 diabetes risk among Western populations. The positive relationship presents a significant dose-response manner. Wisely controlled potato consumption may confer potential glucometabolic benefits.

Original title:
Dietary potato intake and risks of type 2 diabetes and gestational diabetes mellitus by Guo F, Zhang Q, [...], Ma L.

Link:
https://pubmed.ncbi.nlm.nih.gov/34130021/

Additional information of El Mondo:
Find more information/studies on potato intakes and diabetes right here.

Vitamin C supplements improve triglyceride and cholesterol levels in patients with type 2 diabetes mellitus

Afbeelding

Objectives:
Does vitamin C supplementation improve triglyceride and cholesterol levels in patients with type 2 diabetes mellitus?

Study design:
This review article included 15 studies with 872 participants.

Results and conclusions:
The investigators found, findings from 15 studies indicated that vitamin C supplementation significantly decreased triglyceride (TG) levels [WMD= -16.48 mg/dL, 95% CI = -31.89 to -1.08, p 0.001] and total cholesterol (TC) levels [WMD = -13.00 mg/dL, 95% CI = -23.10 to -2.91, p 0.001] in patients with type 2 diabetes mellitus.

The investigators found, however, vitamin C supplementation failed to improve LDL (bad cholesterol) and HDL cholesterol (good cholesterol) levels. 

The investigators found the meta-regression analysis suggested that lipid profile improvement was affected by duration of vitamin C treatment.

The investigators found dose-response analysis showed that vitamin C supplementation changed LDL cholesterol significantly based on vitamin C dose.

The investigators concluded that vitamin C supplementation improves lipid profile via decreases in triglyceride and total cholesterol levels in patients with type 2 diabetes mellitus. It appears that vitamin C supplementation is more beneficial to lipid profile in long-term vs. short term interventions.

Original title:
Does vitamin C supplementation exert profitable effects on serum lipid profile in patients with type 2 diabetes? A systematic review and dose-response meta-analysis by Namkhah Z, Ashtary-Larky D, […], Asbaghi O.

Link:
https://pubmed.ncbi.nlm.nih.gov/33984490/

Additional information of El Mondo:
Find more information/studies on vitamine C, cholesterol and diabetes right here.


A diet with low GI increases metabolic syndrome

Afbeelding

Objectives:
Diets with high glycemic index (GI) or high glycemic load (GL) have been linked to important risk factors associated with the development of metabolic syndrome (MetS), such as dyslipidemia, higher blood glucose and insulin concentrations. However, the role of GI and GL in relation to metabolic syndrome is still understudied and controversial. Therefore, this review article has been conducted.

Does high dietary GI or GL increase risk of metabolic syndrome?

Study design:
This review article included 1 cohort study and 11 cross-sectional studies with a total sample size of 36,295 subjects.

Results and conclusions:
The investigators found, the pooled effect sizes from the 9 studies indicated high versus low dietary GI was significantly associated with increased risk of 5% for metabolic syndrome [OR = 1.05, 95% CI = 1.01 to 1.09, I2 = 58.1%, p = 0.004].
This finding was supported by all subgroup analyses except where studies used 24-h recalls for dietary assessment.

The investigators found, additionally, a linear dose-response investigation revealed that each 5-point increment in GI was associated with 2% increase in the risk of metabolic syndrome [OR = 1.02, 95% CI = 1.01 to 1.02].
Howver, non-linear pattern was insignificant [p-nonlinearity = 0.63].

The investigators found, moreover, pooled effect sizes from 10 studies suggested that no association was found between the GL and metabolic syndrome with results remaining consistent in all subgroup analyses.

The investigators concluded that high dietary GI increases risk of metabolic syndrome. Nutrition policy and clinical practices should encourage a diet with low GI. Future studies should include both GI and GL and different criteria of metabolic syndrome to provide a better comparison.

Original title:
Glycemic index, but not glycemic load, is associated with an increased risk of metabolic syndrome: Meta-analysis of observational studies by Askari M, Dehghani A, […], Alizadeh S.

Link:
https://pubmed.ncbi.nlm.nih.gov/33928722/

Additional information of El Mondo:
Find more information/studies on GI and overweight right here.

A diet with low GI is a diet with GI of 55 or lower.

Spirulina supplementation reduces bad cholesterol among type 2 diabetes patients

Afbeelding

Objectives:
Does spirulina supplementation improve glycemic related markers (like, fasting blood glucose, post prandial blood sugar and HbA1c levels) and lipid profile (like, triglyceride and cholesterol levels) among type 2 diabetes patients?

Study design:
This review article included 8 RCTs (9 arms).

Results and conclusions:
The investigators found, spirulina supplementation significantly reduced fasting blood glucose levels [-17.88 mg/dL, 95% CI = -26.99 to -8.78, I2 = 25%] among type 2 diabetes patients.

The investigators found, spirulina supplementation significantly reduced triglyceride levels [-30.99 mg/dL, 95% CI = -45.20 to -16.77, I2 = 50%] among type 2 diabetes patients.

The investigators found, spirulina supplementation significantly reduced total cholesterol levels [-18.47 mg/dL, 95% CI = -33.54 to -3.39, I2 = 73%] among type 2 diabetes patients.

The investigators found, spirulina supplementation significantly reduced LDL cholesterol (bad cholesterol) levels [-20.04 mg/dL, 95% CI = -34.06 to -6.02, I2 = 75%] among type 2 diabetes patients.

The investigators found, spirulina supplementation significantly reduced VLDL cholesterol levels [-6.96 mg/dL, 95% CI = -9.71 to -4.22, I2 = 33%] among type 2 diabetes patients.

The investigators found, spirulina supplementation significantly increased HDL cholesterol (good cholesterol) levels among type 2 diabetes patients.

The investigators found no significant effect on HbA1C or post prandial blood sugar among type 2 diabetes patients following spirulina supplementation.

The investigators concluded that spirulina supplementation has beneficial effects on fasting blood glucose and blood lipid profiles among type 2 diabetes patients.

Original title:
The effect of spirulina on type 2 diabetes: a systematic review and meta-analysis by Hatami E, Ghalishourani SS, […], Mansour-Ghanaei F.

Link:
https://pubmed.ncbi.nlm.nih.gov/34178867/

Additional information of El Mondo:
Find more information/studies on lowering cholesterol levels and diabetes right here.

Grapes/grape products supplementation reduces HOMA-IR values in adults

Objectives:
Does grapes/grape products supplementation improve glycemic indices (like HOMA-IR, Hb1Ac and fasting insulin level) in adults or in other words, does eating grapes or grape products causally improve glycemic indices in adults?

Study design:
This review article included 29 RCTs with a total of 1,297 participants.

Results and conclusions:
The investigators found, overall, the grapes/grape products supplementation significantly reduced homeostatic model assessment of insulin resistance (HOMA-IR) [WMD = -0.54, 95% CI = -0.91 to -0.17, p = 0.004] in adults.   
Significantly because the calculated p-value of = 0.004 was less than the p-value of 0.05.

The investigators found, however, the grapes/grape products supplementation did not affect fasting insulin levels [WMD = -0.90 μIU/mL, 95% CI = -1.04 to 2.84, p = 0.362] and hemoglobin A1c (Hb1Ac) percentage [WMD = 0.00%, 95% CI = -0.10 to 0.11, p = 0.916] in the main analyses.
Did not affect because the calculated p-value of 0.916 was larger than the p-value of 0.05.

The investigators concluded that the grapes/grape products supplementation reduces homeostatic model assessment of insulin resistance (HOMA-IR) in adults. Further, large-scale RCTs with longer duration are required to confirm these results.

Original title:
The effect of grapes/grape products on glycemic response: A systematic review and meta-analysis of randomized controlled trials by Moodi V, Abedi S, […], Miraghajani M.

Link:
https://pubmed.ncbi.nlm.nih.gov/33893683/

Additional information of El Mondo:
Find more information/studies on fruit and diabetes right here.

Homeostatic model assessment of insulin resistance (HOMA-IR) is a method for assessing β-cell function and insulin resistance (IR) from basal (fasting) glucose and insulin or C-peptide concentrations. HOMA-IR is an indicator of insulin resistance in diabetic patients. The higher the value, the more resistant you are to insulin. Diabetic patients often have a high HOMA-IR value.

Insufficiency of serum carotenoids increases overweight and obesity

Afbeelding

Objectives:
Excess body weight, including overweight and obesity, is one of the major factors influencing human health and plays an important role in the global burden of disease. Carotenoids serve as precursors of vitamin A-related retinoids and are considered to have potential effects on many diseases. However, the influence of carotenoids on people with excess body weight is unclear. Therefore, this review article has been conducted.

Does carotenoid supplementation reduce risk of overweight and obesity in overweight or obese subjects?

Study design:
This review article included 7 randomized controlled trials (RCTs) and 8 observational studies with 28,944 subjects and data on multiple carotenoid subgroups, including lycopene, astaxanthin, cryptoxanthin, α-carotene, and β-carotene.

In all included RCTs, the intervention duration was 20 days at the shortest and 16 weeks at the longest and the range of intervention doses was 1.2-60 mg/d.

Results and conclusions:
The investigators found that the insufficiency of serum carotenoids significantly increased risk of overweight and obesity with 73% [OR = 1.73, 95% CI = 1.57 to 1.91, p 0.001].

The investigators found, moreover, carotenoid supplementation was significantly associated with body weight reductions [SMD = -2.34 kg, 95% CI = -3.80 to -0.87 kg, p 0.001], body mass index decrease [SMD = -0.95 kg/cm2, 95% CI = -1.88 to -0.01 kg/cm2, p 0.001] and waist circumference losses [SMD = -1.84 cm, 95% CI = -3.14 to -0.54 cm, p 0.001].

The investigators concluded that 1.2-60 mg/d carotenoid supplementation reduces risk of overweight and obesity in overweight or obese subjects. Furthermore, an insufficiency of serum carotenoids is a risk factor for overweight and obesity. Additional data from large clinical trials are needed.

Original title:
The association between carotenoids and subjects with overweight or obesity: a systematic review and meta-analysis by Yao N, Yan S, […], Cui W.

Link:
https://pubmed.ncbi.nlm.nih.gov/33977977/

Additional information of El Mondo:
Find more information/studies on carotenoid consumption and obesity/overweight right here.

Am I overweight?
 

Chromium supplementation improves lipid profile in patients with type 2 diabetes mellitus

Afbeelding

Objectives:
Does chromium supplementation improve lipid profile (serum levels of triglyceride and cholesterol) in patients with type 2 diabetes mellitus (T2DM)?

Study design:
This review article included  24 RCTs (with 28 effect sizes).

Results and conclusions:
The investigators found that chromium supplementation resulted in a significant decrease in serum levels of triglyceride (TG) in patients with type 2 diabetes mellitus [MD = -6.54 mg/dL, 95 % CI = -13.08 to -0.00, p = 0.050].
Significant means that there is an association with a 95% confidence.

The investigators found that chromium supplementation resulted in a significant decrease in serum levels of total cholesterol (TC) in patients with type 2 diabetes mellitus [WMD = -7.77 mg/dL, 95 % CI = -11.35 to -4.18, p 0.001].

The investigators found that chromium supplementation significantly increased high-density lipoprotein cholesterol (HDL cholesterol or good cholesterol) in patients with type 2 diabetes mellitus [WMD = 2.23 mg/dL, 95 % CI = 0.07 to 4.40, p = 0.043] level.

The investigators found, however, chromium supplementation did not have significant effects on low-density lipoprotein cholesterol (LDL cholesterol or bad cholesterol) in patients with type 2 diabetes mellitus [WMD = -8.54 mg/dL, 95 % CI = -19.58 to 2.49, p = 0.129] level.

The investigators concluded that chromium supplementation decreases serum levels of triglyceride (TG) and total cholesterol (TC) and increases HDL cholesterol (good cholesterol) levels in patients with type 2 diabetes mellitus. It should be noted that the lipid-lowering properties of chromium supplementation are small and may not reach clinical importance.

Original title:
Effects of chromium supplementation on lipid profile in patients with type 2 diabetes: A systematic review and dose-response meta-analysis of randomized controlled trials by Asbaghi O, Naeini F, […], Naeini AA.

Link:
https://pubmed.ncbi.nlm.nih.gov/33813266/

Additional information of El Mondo:
Find more information/studies on chromium, cholesterol and diabetes right here.

Obesity increases atrial fibrillation recurrence in patients undergoing catheter ablation

Afbeelding

Objectives:
The evidence on the association between obesity and atrial fibrillation (AF) recurrence was equivocal. Therefore, this review article (meta-analysis) has been conducted.

Does obesity increase risk of atrial fibrillation recurrence in patients undergoing catheter ablation?

Study design:
This review article included 20 studies with 52,771 patients.

Results and conclusions:
The investigators found that obesity was significantly associated with higher atrial fibrillation recurrence [OR = 1.30, 95% C = 1.16 to 1.47, p 0.001, I2 = 72.7%] and similar rate of adverse events [OR = 1.21, 95% CI = 0.87 to 1.67, p = 0.264, I2 = 23.9%] in patients undergoing catheter ablation.

The investigators found meta-regression showed that the association varied by age [coefficient = -0.03, p = 0.024].

The investigators found meta-analysis of highest versus lowest BMI showed that the highest group had higher atrial fibrillation recurrence [OR = 1.37, 95% CI = 1.18 to 1.58, p 0.001, I2 = 64.9%] and adverse events [OR = 2.02, 95% CI = 1.08 to 3.76, p = 0.028, I2 = 49.5%] in patients undergoing catheter ablation.

The investigators found the dose-response relationship for BMI and atrial fibrillation recurrence was nonlinear [p nonlinearity 0.001], the curve became steeper at 30-35 kg/m2.

The investigators found for adverse events, an increase of 1% for every 1 kg/m2 increase in BMI [OR = 1.01, 95% CI = 1.00 to 1.02, p = 0.001], the relationship was nonlinear [p nonlinearity = 0.001].

The investigators concluded that obesity is associated with higher atrial fibrillation recurrence in patients undergoing catheter ablation. High BMI is associated with a higher risk for adverse events.

Original title:
BMI and atrial fibrillation recurrence post catheter ablation: A dose-response meta-analysis by Pranata R, Henrina J, […], Munawar M.

Link:
https://pubmed.ncbi.nlm.nih.gov/33544873/

Additional information of El Mondo:
Find more information/studies on cardiovascular diseases and obesity/overweight right here.

Catheter ablation is a procedure that uses radiofrequency energy (similar to microwave heat) to destroy a small area of heart tissue that is causing rapid and irregular heartbeats. Destroying this tissue helps restore your heart’s regular rhythm. Catheter ablation is also called radiofrequency ablation.

Am I overweight?
 

Brown rice has anti-obesity effects in comparison with white rice

Afbeelding

Objectives:
A few randomized controlled trials (RCTs) have assessed the effect of brown rice consumption on metabolic parameters (such as, weight, height, waist circumference, fasting glucose, LDL, HDL, total cholesterol, triglycerides and blood pressure) compared to white rice, with inconsistent findings. Therefore, this review article has been conducted.

Is the effect of brown rice on adiposity indices (such as, weight, height and waist circumference), lipid profile (such as, LDL, HDL, total cholesterol and triglycerides) and glycemic markers (such as, fasting blood glucose) higher compared to white rice in adult subjects?

Study design:
This review article included 13 RCTs.
In accordance with Grading of Recommendations Assessment, Development and Evaluation (GRADE) approach, the certainly of the included evidence was low and very low.

Results and conclusions:
The investigators found brown rice significantly reduced:
weight by -1.63 kg [95% CI = -2.15 to -1.11, I2 = 97%, n = 6];
body mass index (BMI) by -0.58 kg/m2 [95% CI = -0.78 to -0.37, I2 = 96%, n = 6] and;
waist circumference by -2.56 cm [95% CI = -4.86 to -0.26, I2 = 88%, n = 5] compared with white rice.

The investigators found, moreover, brown rice had no significant effect on lipid profile and glycemic markers.

The investigators found pre-germinated brown rice significantly declined:
weight by -1.75 kg [95% CI = -2.70 to -0.81, I2 = 99%, n = 4];
total cholesterol by -24.22 mg/dL [95% CI = -33.03 to -15.41, I2 = 78%, n = 5];
triglyceride (TG) by -43.28 mg/dL [95% CI = -74.05 to -12.50, I2 = 90%, n = 5];
low-density lipoprotein (LDL or bad cholesterol) by -20.05 mg/dL [95% CI = -29.57 to -10.52, I2 = 71%, n = 5] and;
fasting blood glucose (FBG) by -15.83 mg/dL [95% CI = -25.20 to -6.46, I2 = 91%, n = 5] compared to white rice.

The investigators concluded brown rice has anti-obesity effects in comparison with white rice. However, it has no beneficial effects on lipid profile and glycemic markers. Furthermore, pre-germinated brown rice has better functional effects on promoting lipid profile and fasting blood glucose compared to brown rice.

Original title:
The effect of brown rice compared to white rice on adiposity indices, lipid profile, and glycemic markers: a systematic review and meta-analysis of randomized controlled trials by Golzarand M, Toolabi K, […], Mirmiran P.

Link:
https://pubmed.ncbi.nlm.nih.gov/33905269

Additional information of El Mondo:
Find more information/studies on rice consumption and obesity/overweight right here.

No effect of vitamin E supplementation on weight, BMI and waist circumference

Objectives:
Several mechanisms have been proposed for the effect of vitamin E on weight loss. Yet various interventional studies with wide ranges of doses and durations have reported contradictory results. Therefore, this review article has been conducted.

Does vitamin E supplementation reduce overweight?

Study design:
This review article included 24 RCTs.

Results and conclusions:
The investigators found there was no significant effect of vitamin E supplements on weight [WMD = 0.15, 95% CI = -1.35 to 1.65, p = 0.847], body mass index (BMI) [WMD = 0.04, 95% CI = -0.29 to 0.37, p = 0.815] and waist circumference (WC) [WMD = -0.19 kg, 95% CI = -2.06 to 1.68, p = 0.842], respectively.

The investigators found, however, subgroup analysis revealed that vitamin E supplementation in studies conducted on participants with normal BMI (18.5-24.9) had increasing impact on BMI [p = 0.047].  

The investigators concluded there is no significant effect of vitamin E supplementation on weight, BMI and waist circumference (WC). However, vitamin E supplementation increases BMI in participants with normal BMI (18.5-24.9).

Original title:
Can vitamin E supplementation affect obesity indices? A systematic review and meta-analysis of twenty-four randomized controlled trials by Emami MR, Jamshidi S, […], Aryaeian N.

Link:
https://pubmed.ncbi.nlm.nih.gov/33632535/

Additional information of El Mondo:
Find more information/studies on vitamin E and obesity/overweight right here.

L-arginine supplements do not reduce diabetes in adults

Afbeelding

Objectives:
Does L-arginine supplementation improve biomarkers (fasting blood sugar, insulin, HbA1c and HOMA-IR values) of glycemic control in adults?

Study design:
This review article included 12 randomised clinical trials (RCTs).

Results and conclusions:
The investigators found L-arginine supplementation had no significant effect on serum fasting blood sugar (FBS) [weighted mean difference (WMD) = -3.38 mg/dL, 95% CI = -6.79 to 0.04, p = 0.53], serum insulin [WMD = -0.12 Hedges' g, 95% CI = -0.33 to 0.09, p = 0.27], glycated haemoglobin A1c (HbA1c) [WMD = -0.04%, 95% CI = -0.25 to 0.17, p = 0.71] and homeostasis model assessment for insulin resistance (HOMA-IR) [WMD = -0.48, 95% CI = -1.15 to 0.19, p = 0.15].
No significant because the calculated p-value of 0.15 was larger than the p-value of 0.05.

The investigators concluded although several animal studies have proposed that L-arginine supplementation might improve blood glucose control, the present review article could not confirm this benefit in humans.

Original title:
Effects of L-arginine supplementation on biomarkers of glycemic control: a systematic review and meta-analysis of randomised clinical trials by Karimi E, Hatami E, […], Askari G.

Link:
https://pubmed.ncbi.nlm.nih.gov/33426939/

Additional information of El Mondo:
Find more information/studies on L-arginine and diabetes right here.

Arginine is classified as a semiessential or conditionally essential amino acid, depending on the developmental stage and health status of the individual, that helps the body build protein. L-arginine is also found in most protein-rich foods, including fish, red meat, poultry, soy, whole grains, beans and dairy products.
 

1.5 g/day garlic supplementation reduces adiponectin level among participants ˂30 years

Afbeelding

Objectives:
Does garlic supplementation reduce adiponectin and leptin serum levels?

Study design:
This review article included 5 RCTs.

Results and conclusions:
The investigators found that garlic supplementation did not significantly affect adiponectin [Hedges's = 0.20, 95% CI = -0.06 to 0.47, p = 0.12] and leptin [Hedges's = 0.08, 95% CI = -0.26 to 0.41, p = 0.65] concentrations in comparison with placebo.

The investigators found, however, in the subgroup analysis, significantly increased serum adiponectin level was seen following garlic supplementation in trials with a mean age of participants ˂30 years [Hedges's = 0.44, 95% CI = 0.01 to 0.87, p = 0.04], the doses ˂1.5 g/day [Hedges's = 0.38, 95% CI = 0.02 to 0.71, p = 0.04] and trials with duration ≥8 weeks [Hedges's = 0.48, 95% CI = 0.08 to 0.89, p = 0.02].

The investigators concluded that ˂1.5 g/day garlic supplementation during ≥8 weeks reduces adiponectin level among participants ˂30 years.

Original title:
Systematic review and meta-analysis of randomized, controlled trials on the effects of garlic supplementation on serum adiponectin and leptin levels by Shekarchizadeh-Esfahani P, Hassani B, […], Soraya N.

Link:
https://pubmed.ncbi.nlm.nih.gov/33792129/

Additional information of El Mondo:
Find here more information/studies about review article/significant and garlic.

Adiponectin is a fat-derived hormone that appears to play a crucial role in protecting against insulin resistance/diabetes and atherosclerosis (atherosclerosis is the dominant cause of cardiovascular disease (CVD)). Decreased adiponectin levels are thought to play a central role in the development of obesity, cardiovascular disease and type 2 diabetes in humans.